Getting started with BIDEAL
DEMO
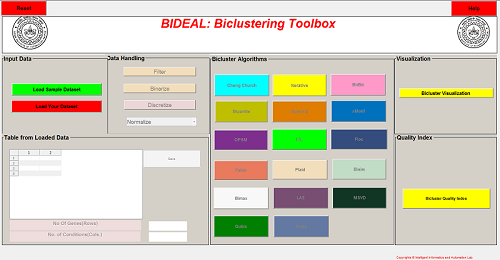
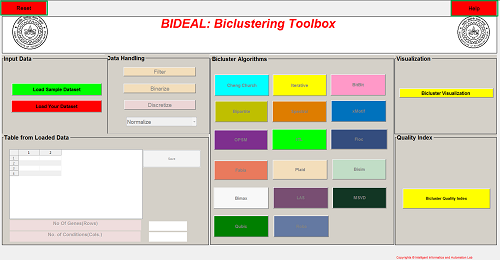
- Double click on BIDEAL_GUI.exe a window will appear as shown below:
- Load sample data or insert data file of your own. Then all the pre-processing and algorithms buttons will be enabled.
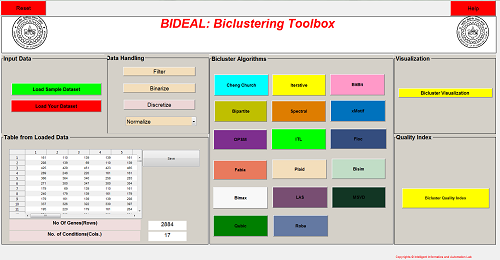
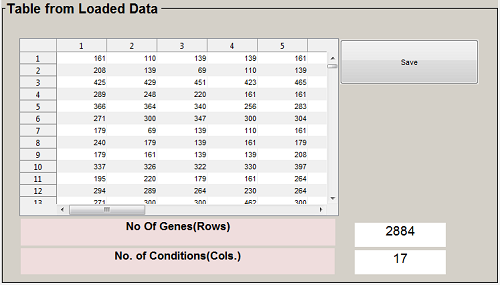
- Data will be shown in a table. No of genes and no of conditions will be displayed below. Here yeast dataset is loaded. No of genes is 2884 and no of conditions is 17
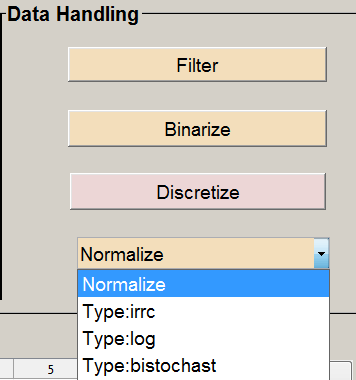
- Click on different pre-processing steps to execute. Data after each operation will be shown in the table. Changed data can be saved by clicking on the Save button.
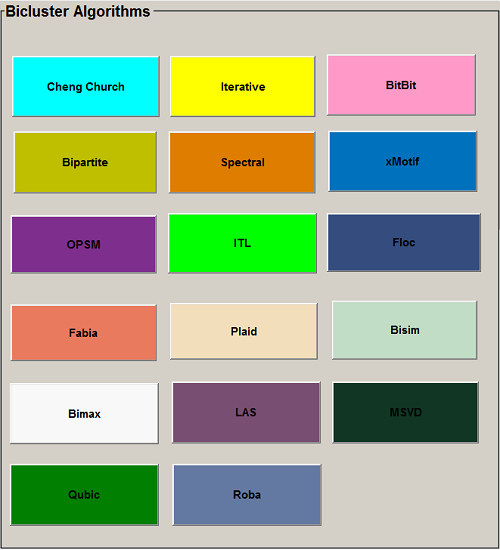
- Any algorithm can be chosen from the algorithm panel as shown. Lets say Cheng and Church Algorithm is chosen. Execution will be started. At that time other buttons are disable.User will be asked to give the input parameters. Though default values will be given
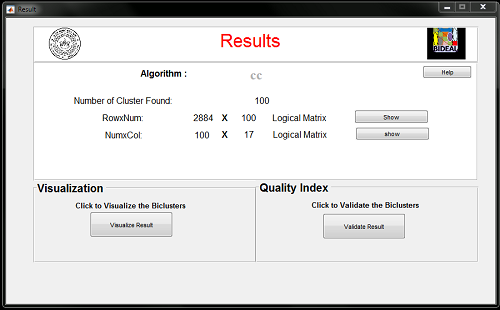
- After execution a new window will be opened as shown below. It displays the summary of the result. Row×Num and Num×Col both are logical matrices.
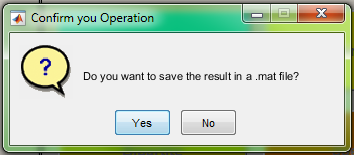
- User will be asked to save the result. Result can be saved in .mat file in preferred path as shown below. The indices of rows and columns of the input data matrix will be saved with their corresponding Bicluster number in two .csv files automatically.
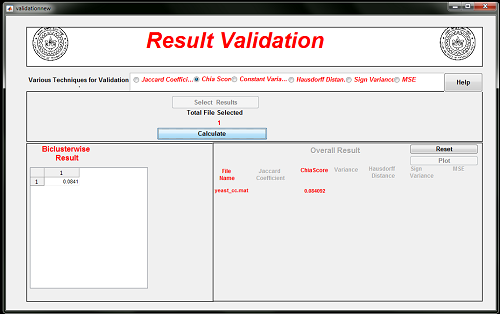
- Generated Bicluster can be validated with various quality indices. Validation window will be appear as follows.
- Previously stored result will be loaded automatically. Click on the desired index and click on the Calculate button. Values will be shown in the panel
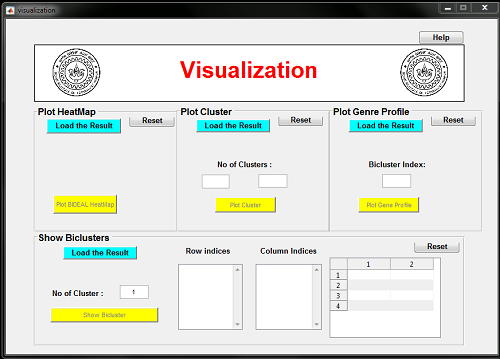
- Generated result can also be visualized by clicking on the button Visualize The Result. A window will appear as shown below.
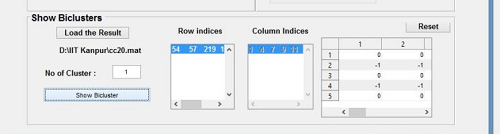
- For visualization of Bicluster as a numerical matrix put the desired index of Bicluster ,The particular Bicluster with row and column indices and the total matrix will be shown
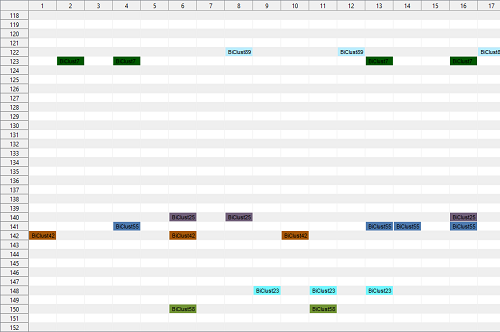
- For visualization of HeatMap of Bicluster load the result and click on Plot BIDEAL HeatMap. Heat Map will be generated as shown below.
- Bicluster mean median and mode can be plotted by clicking on Plot Cluster. Cluster Map will be generated as shown below.
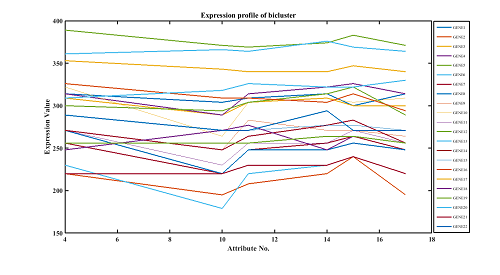
- Genre Profile of a specific Bicluster index can be plotted by clicking on Plot Genre Profile. It will be generated as shown below.
- Reset button will bring the homepage of toolbox. Only data loading panel will be enabled. About button is also given to know some relevant information regarding the software.


How to cite?
Please cite the following paper:
N. K. Verma, T. Sharma, S. Dixit, P. Agrawal, S. Sengupta, and V. Singh, BIDEAL: A Toolbox for Bicluster Analysis - Generation, Visualization and Validation,
SN COMPUTER SCIENCE, Springer Journal, 2, 24 (2021). https://doi.org/10.1007/s42979-020-00411-9